BECE Basic Science 2023 Objective — Question 98
Question 98 of 119 from the Basic Education Certificate Examination (Junior WAEC) (BECE) Basic Science 2023 Objective paper, with the correct answer and a full explanation.
Advertisement
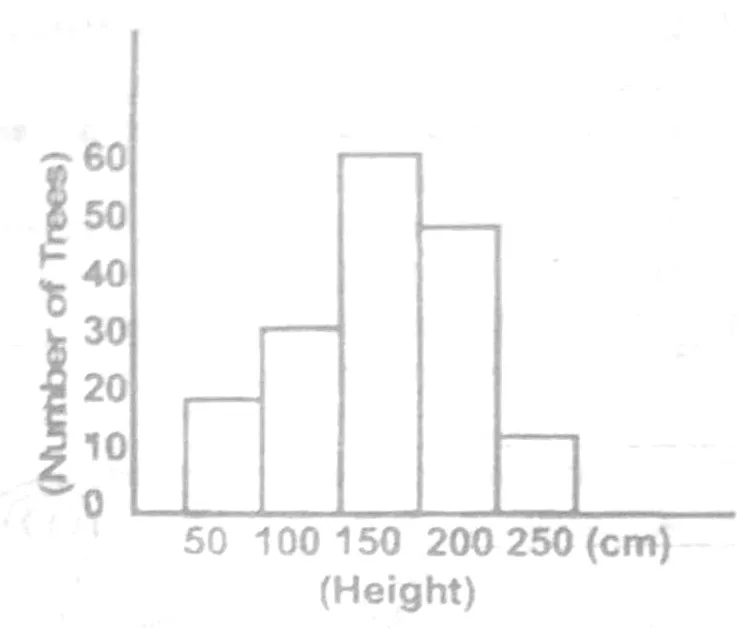
The graphical illustration below is a
- A. bar chart.
- B. histogram.Correct
- C. line graph.
- D. pictogram.
- E. pie chart.
Explanation
The bars touch each other and show a continuous range of heights. This is a histogram.
Advertisement
Sign up free to unlock
- Score tracking
- Practice history
- Saved questions
- Progress dashboard
- Personalized sessions
- Weak-topic breakdown
…and/or go further with premium services and No Ads.