JAMB Economics 2008 Objective — Question 23
Question 23 of 50 from the Joint Admissions and Matriculation Board (JAMB) Economics 2008 Objective paper, with the correct answer and a full explanation.
Advertisement
In the diagram above showing curves MC, AC, AVC and AFC, the curve shows that MC
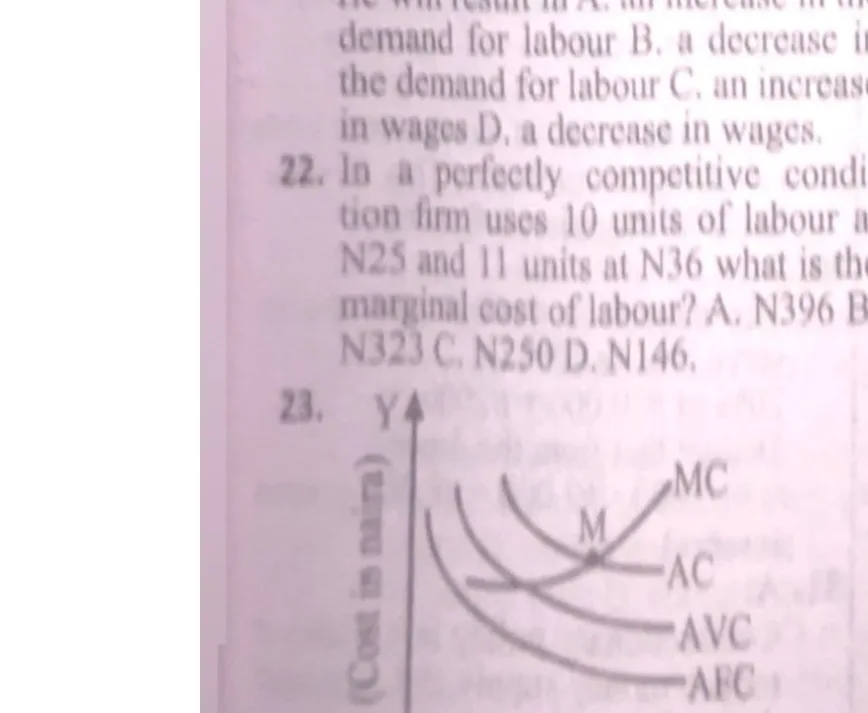
- A. cuts AC at its minimum pointCorrect
- B. and AC rise simultaneously
- C. cuts AC at its maximum point
- D. is falling
Explanation
The diagram shows that MC cuts AC at its minimum point, and AC rises simultaneously; MC cuts AC at its maximum point D is falling.
Advertisement
Sign up free to unlock
- Score tracking
- Practice history
- Saved questions
- Progress dashboard
- Personalized sessions
- Weak-topic breakdown
…and/or go further with premium services and No Ads.