Post-UTME Mathematics 2017 Objective — Question 50
Question 50 of 50 from the Post-UTME Screening (Post-UTME) Mathematics 2017 Objective paper, with the correct answer and a full explanation.
Advertisement
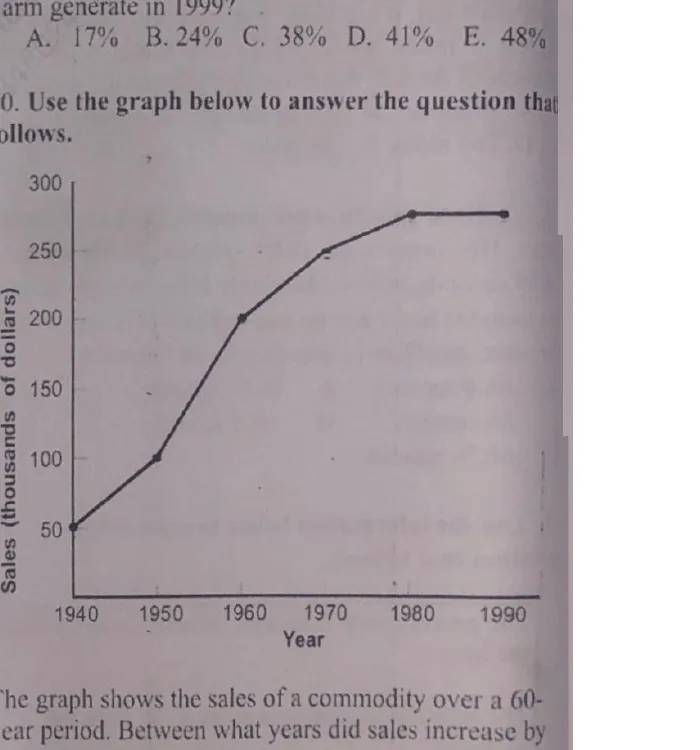
Use the graph below (Sales of a commodity, thousands of dollars, 1940-1990) to answer the question. Between what years did sales increase by the greatest amount?
- A. between 1940 and 1950
- B. between 1950 and 1960Correct
- C. between 1960 and 1970
- D. between 1970 and 1980 / E. between 1980 and 1990
Explanation
Sales rose from about $100k in 1950 to about $200k in 1960, the largest jump of any decade shown.
Advertisement
Sign up free to unlock
- Score tracking
- Practice history
- Saved questions
- Progress dashboard
- Personalized sessions
- Weak-topic breakdown
…and/or go further with premium services and No Ads.