WAEC Chemistry 2012 Objective — Question 30
Question 30 of 50 from the West African Examinations Council (WAEC) Chemistry 2012 Objective paper, with the correct answer and a full explanation.
Advertisement
2HCl(aq) + CaCO3(s) → CaCl2 + CO2(g) + H2O(l). From the reaction above, which of the curves represents the production of CO2 gas as dilute HCl is added to the apparatus shown (with an empty flask, sodium, and water)?
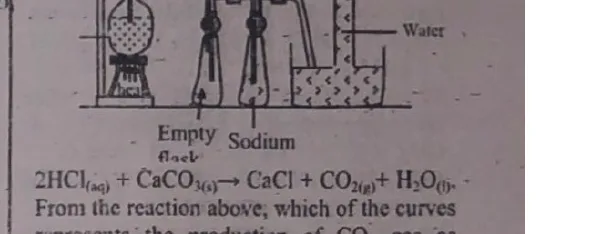
- A. L
- B. MCorrect
- C. N
- D. P
Explanation
Curve M represents the production of CO2 gas over time as dilute HCl is gradually added to the calcium carbonate, based on the shape of gas evolution shown in the source diagram.
Advertisement
Sign up free to unlock
- Score tracking
- Practice history
- Saved questions
- Progress dashboard
- Personalized sessions
- Weak-topic breakdown
…and/or go further with premium services and No Ads.