WAEC Chemistry 2015 Objective — Question 28
Question 28 of 50 from the West African Examinations Council (WAEC) Chemistry 2015 Objective paper, with the correct answer and a full explanation.
Advertisement
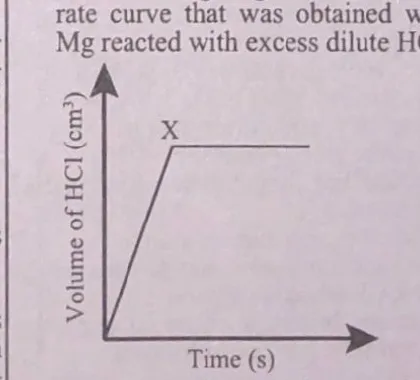
The following diagram illustrates the rate curve that was obtained when Mg reacted with excess dilute HCl. The diagram became horizontal at X because
- A. the reaction was slowed down
- B. all the dilute HCl has reacted
- C. all the Mg has reactedCorrect
- D. hydrogen gas is produced at a steady rate
Explanation
The curve becomes horizontal (flat) at X because the reaction has stopped - all the magnesium (the limiting reagent, since HCl is in excess) has reacted.
Advertisement
Sign up free to unlock
- Score tracking
- Practice history
- Saved questions
- Progress dashboard
- Personalized sessions
- Weak-topic breakdown
…and/or go further with premium services and No Ads.