WAEC Chemistry 2021 Objective — Question 11
Question 11 of 50 from the West African Examinations Council (WAEC) Chemistry 2021 Objective paper, with the correct answer and a full explanation.
Advertisement
Which of the graphs illustrates the variation of the solubility of a salt in water (y-axis) with increase in temperature (x-axis), if the dissolution process is exothermic?
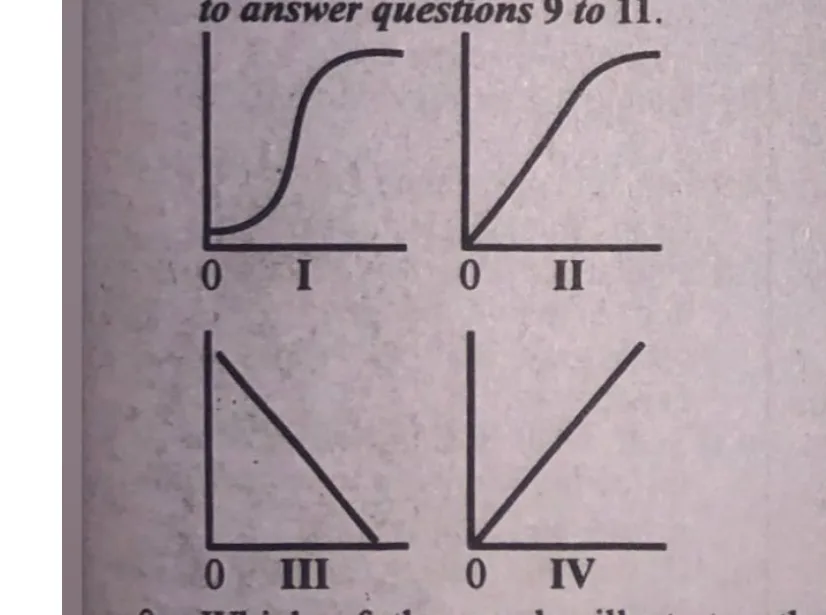
- A. I
- B. II
- C. IIICorrect
- D. IV
Explanation
Since dissolution is exothermic, increasing temperature reduces solubility (Le Chatelier's principle) — a downward-sloping graph, shown in III.
Advertisement
Sign up free to unlock
- Score tracking
- Practice history
- Saved questions
- Progress dashboard
- Personalized sessions
- Weak-topic breakdown
…and/or go further with premium services and No Ads.