WAEC Economics 2011 Theory — Question 6
Question 6 of 25 from the West African Examinations Council (WAEC) Economics 2011 Theory paper, with the correct answer and a full explanation.
Advertisement
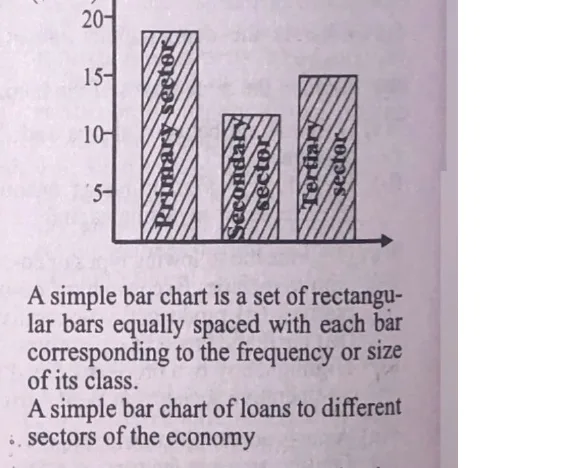
2(c) Present the total loans granted to the sectors in a simple bar chart. (Use of graph sheet is essential)
Model answer
A simple bar chart is a set of rectangular bars, equally spaced, with each bar corresponding to the frequency or size of its class - here showing loans of approximately $18,000 (primary), $4,000 (secondary) and $23,000 (tertiary) to the different sectors of the economy.
Advertisement
Sign up free to unlock
- Score tracking
- Practice history
- Saved questions
- Progress dashboard
- Personalized sessions
- Weak-topic breakdown
…and/or go further with premium services and No Ads.