WAEC Further Mathematics 2022 Theory — Question 13
Question 13 of 15 from the West African Examinations Council (WAEC) Further Mathematics 2022 Theory paper, with the correct answer and a full explanation.
Advertisement
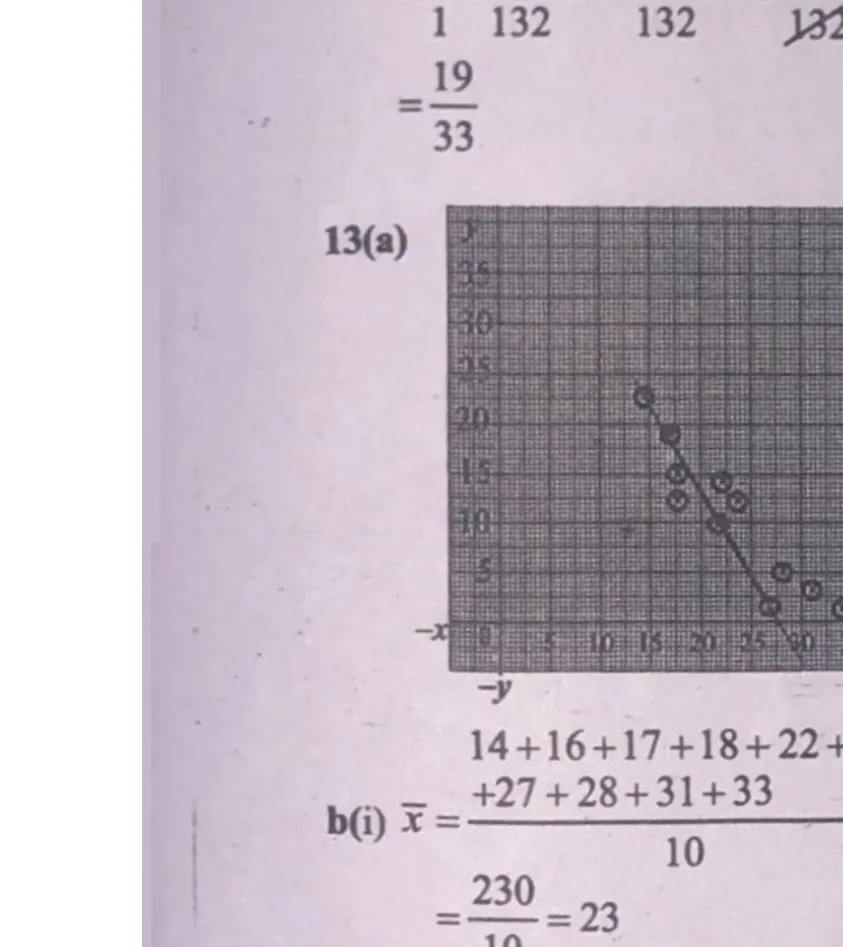
The table shows the corresponding values of two variables X and Y: x: 14,16,17,18,22,24,27,28,31,33 y: 22,19,15,13,10,12,3,5,3,2 (a) Plot a scatter diagram to represent the data. (b) Calculate: (i) x̄, the mean of x, and ȳ, the mean of y; (ii) x̄₁, the mean of x values below x̄, and ȳ₁, the mean of the corresponding y values below x̄. (c) Draw the line of best fit through (x̄,ȳ) and (x̄₁,ȳ₁). (d) From the graph, determine the: (i) relationship between X and Y; (ii) value of y when x is 20.
Model answer
(a)/(c) See scatter diagram with line of best fit in the Diagram column. (b)(i) x̄ = 230/10 = 23. ȳ = 104/10 = 10.4. (ii) Values of x below x̄(23): 14,16,17,18,22 → x̄₁ = 87/5 = 17.4. Corresponding y-values: 22,19,15,13,10 → ȳ₁ = 79/5 = 15.8. (d)(i) As X increases, Y decreases — the variables show a negative (inverse) correlation. (ii) Using the line through (17.4,15.8) and (23,10.4), the value of y when x=20 is approximately 13.
Advertisement
Sign up free to unlock
- Score tracking
- Practice history
- Saved questions
- Progress dashboard
- Personalized sessions
- Weak-topic breakdown
…and/or go further with premium services and No Ads.