WAEC Physics 2014 Theory — Question 7
Question 7 of 22 from the West African Examinations Council (WAEC) Physics 2014 Theory paper, with the correct answer and a full explanation.
Advertisement
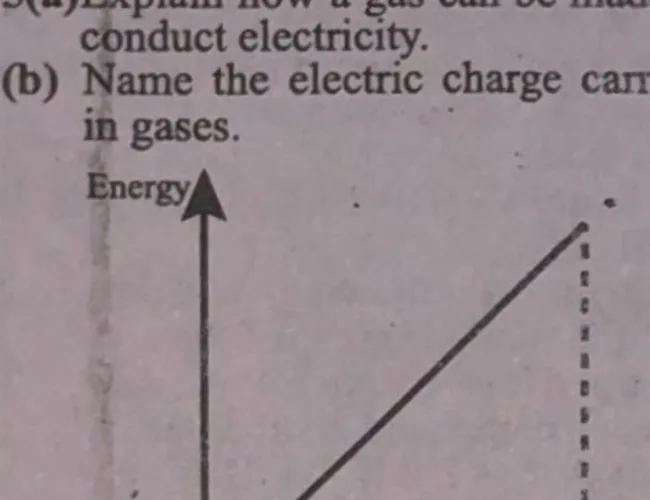
6. The diagram represents the graph of electron energy against the frequency of the radiation incident on a metal surface (photoelectric effect). Interpret the: (a) slope of the graph; (b) intercept, OC; (c) intercept, OK.
Model answer
(a) The slope of the graph represents Planck's constant, h. (b) The intercept OC (on the negative energy axis) represents the work function of the metal (as a negative energy intercept, −W₀). (c) The intercept OK (on the frequency axis) represents the threshold frequency — the minimum frequency of radiation needed to cause photoelectric emission from the metal surface.
Advertisement
Sign up free to unlock
- Score tracking
- Practice history
- Saved questions
- Progress dashboard
- Personalized sessions
- Weak-topic breakdown
…and/or go further with premium services and No Ads.