WAEC Physics 2016 Objective — Question 3
Question 3 of 50 from the West African Examinations Council (WAEC) Physics 2016 Objective paper, with the correct answer and a full explanation.
Advertisement
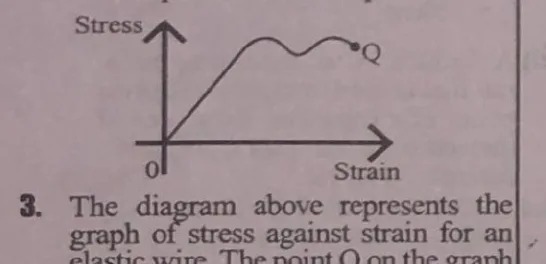
The diagram above represents the graph of stress against strain for an elastic wire. The point Q on the graph is the
- A. elastic limit
- B. breaking point
- C. yield pointCorrect
- D. proportional limit
Explanation
On a stress-strain graph, E=Elastic limit, Y=Yield point, M=Maximum load, F/B=Fracture/breaking point. Point Q corresponds to the Yield point.
Advertisement
Sign up free to unlock
- Score tracking
- Practice history
- Saved questions
- Progress dashboard
- Personalized sessions
- Weak-topic breakdown
…and/or go further with premium services and No Ads.