WAEC Further Mathematics 2025 Theory — Question 5
Question 5 of 16 from the West African Examinations Council (WAEC) Further Mathematics 2025 Theory paper, with the correct answer and a full explanation.
Advertisement
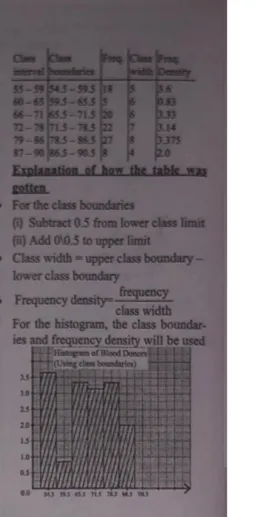
The table shows the distribution of the weights (Newtons) of 100 blood donors: 55-59 (18), 60-65 (5), 66-71 (20), 72-78 (22), 79-86 (27), 87-90 (8). Draw a histogram for the distribution.
Model answer
Using class boundaries (subtract 0.5 from lower limits, add 0.5 to upper limits) and computing class widths and frequency densities (frequency/width): 54.5-59.5 (width 5, density 3.6); 59.5-65.5 (width 6, density 0.83); 65.5-71.5 (width 6, density 3.33); 71.5-78.5 (width 7, density 3.14); 78.5-86.5 (width 8, density 3.375); 86.5-90.5 (width 4, density 2.0). A histogram is then drawn with class boundaries on the x-axis and frequency density on the y-axis, bars drawn to these heights with no gaps between bars.
Advertisement
Sign up free to unlock
- Score tracking
- Practice history
- Saved questions
- Progress dashboard
- Personalized sessions
- Weak-topic breakdown
…and/or go further with premium services and No Ads.